Business Intelligence for SMEs:
From Data to Decisions
For businesses, collecting data is now a given. The real value comes from managing and using that data effectively.
Small and medium-sized businesses (SMEs) collect data through sales records, invoices, customer interactions, project updates, website activity, and operational reports.
This information often remains fragmented across different tools and systems, making it difficult to understand the business as a whole.
Business Intelligence (BI) helps organize and analyze that data so it can support clearer decisions.
This article explores what BI means for SMEs, which dashboards can provide the most value, and how a realistic BI project can begin with the data a business already has.
What Business Intelligence Means for an SME
Business Intelligence is the process of collecting, organizing, analyzing, and presenting business data in a way that supports better decisions.
For an SME, this may involve information from accounting software, spreadsheets, Customer Relationship Management (CRM) platforms, e-commerce systems, or project management tools.
BI helps reveal which products or services generate the most revenue, whether customers are paying on time, where projects are being delayed, and which activities consume resources without producing enough value.
Dashboards make these patterns easier to interpret by highlighting the information most relevant to current priorities.
Why Business Intelligence Is Not Only for Large Corporations
Business Intelligence is often associated with large companies, dedicated analytics teams, and expensive enterprise platforms. However, its value is not defined by company size.
SMEs often manage sales, finances, customer relationships, and daily operations across several tools. As the business grows, tracking performance through separate reports and manual comparisons becomes increasingly difficult.
A BI solution can begin with one dashboard, one business area, or a small number of carefully selected indicators. This makes it easier to adapt the solution to the business’s budget, processes, available data, and decision-making needs.
Three Dashboards That Can Improve Business Decisions
Dashboards are most useful when they are built around specific decisions rather than around every available metric. A clear focus helps direct attention toward the indicators that matter most for the business area they represent.
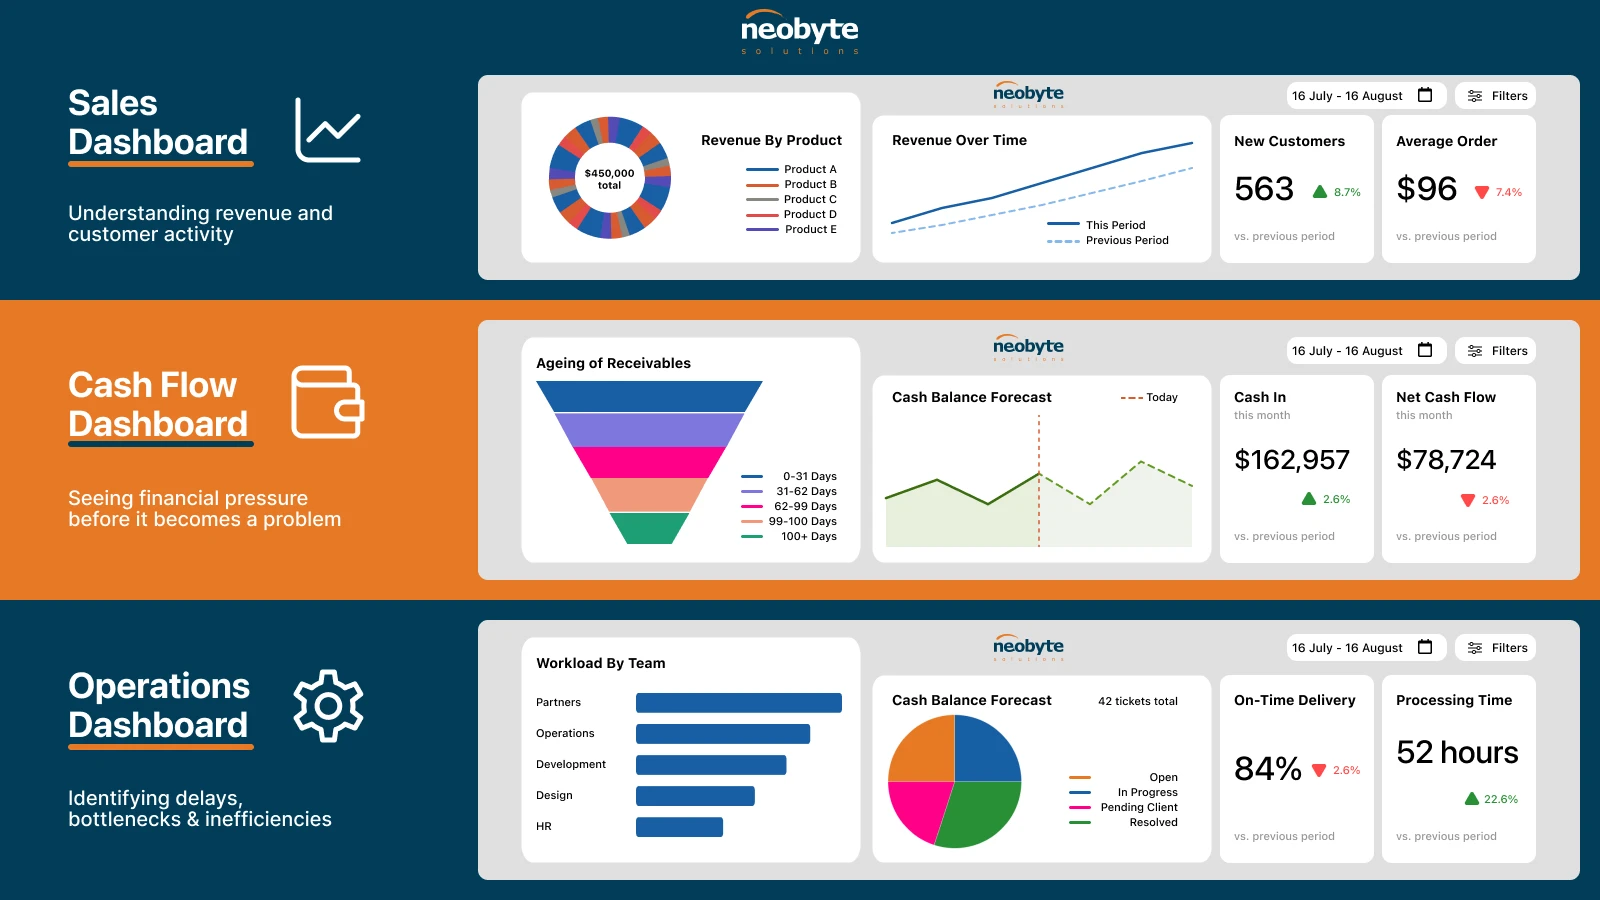
For many SMEs, sales, cash flow, and operations provide a strong starting point because they address three essential business questions:
Sales: Are we generating enough revenue, and from where?
Cash flow: Do we have enough available money to meet our obligations?
Operations: Are we delivering work efficiently?
These are not universally the three most important dashboards for every SME. Priorities vary depending on the business model.
An e-commerce company may focus more on marketing and inventory. A service company may prioritize projects, resource utilization, and profitability. A subscription business may need closer visibility into retention and recurring revenue, while a manufacturer may focus on production, quality, and supply chain performance.
The right dashboard should reflect the decisions the business needs to make most often.
Sales Dashboard: Understanding Revenue and Customer Activity
A sales dashboard shows where revenue comes from and how sales performance changes over time.
It may include:
* revenue by period
* revenue by product, service, customer, or sales channel
* conversion rate
* average order or contract value
* new and repeat customers
* sales pipeline value and stage
* performance against sales targets
The dashboard can reveal which offers and channels perform best, where sales activity is slowing down, and how customer behavior is changing.
For SMEs, this supports decisions related to pricing, promotions, customer retention, sales priorities, and resource allocation.

Cash Flow Dashboard: Seeing Financial Pressure Before It Becomes a Problem
A cash flow dashboard shows the movement of money into and out of the business and how much cash is expected to remain available.
It may include:
* incoming and outgoing cash
* current cash balance
* unpaid and overdue invoices
* upcoming supplier and tax payments
* recurring expenses
* expected payment dates
* projected cash balance
The dashboard provides visibility that helps decision-makers anticipate periods when available funds may become limited, even when the business is generating revenue or reporting a profit.
For SMEs, this supports planning around expenses, supplier payments, investments, financing needs, and other financial commitments.

Operations Dashboard: Identifying Delays, Bottlenecks, and Inefficiencies
An operations dashboard shows how work progresses through the business’s core processes.
It may include:
* work in progress
* project or order completion times
* overdue tasks or delayed deliveries
* production or processing volumes
* employee or team workload
* support request volumes and response times
* resource utilization
* quality issues or rework
The dashboard can show where work is slowing down, which stages create bottlenecks, and where capacity or resources may need adjustment.
For SMEs, this supports decisions related to priorities, staffing, scheduling, workload distribution, and process improvements.

Common Business Intelligence Mistakes
Business Intelligence works best when data, metrics, and business questions are clearly aligned.
One common mistake is tracking too many metrics. A dashboard filled with numbers can become difficult to interpret, while a smaller set of carefully selected indicators provides a clearer overview.
Poor data quality is another frequent issue. Incomplete records, duplicate entries, inconsistent naming, and outdated information can produce misleading results.
Businesses may also build dashboards without first defining the questions they need to answer. Even accurate data can offer little practical value when the dashboard lacks a clear purpose.
As priorities and processes change, BI solutions should also be reviewed and refined.
What a Business Intelligence Project with Neobyte Solutions Could Look Like
A Business Intelligence project begins with identifying the decisions the business needs to support and reviewing the data available across its existing systems.
The next step is to check whether that information is complete, consistent, and reliable enough for accurate reporting. Based on these findings, the most useful indicators can be organized into a dashboard that reflects the business’s workflows and priorities.
The solution is then tested with its users and refined through practical feedback.
Neobyte Solutions can extend the solution gradually as new requirements and opportunities emerge.
Final Thoughts
Business Intelligence gives small and medium-sized businesses a practical way to understand performance, identify areas where pressure is developing, and focus attention on the areas that require action.
Its value depends on relevant business questions, reliable information, and carefully selected indicators.
When these elements are reflected in a well-designed dashboard, businesses gain a clearer view of what is happening and where attention may be needed next.
Our Recommended AI Service
If some of the business data you need is still locked inside invoices, reports, forms, or other documents, we suggest exploring our Document Intelligence service. It can help turn that information into structured data your systems can use.

Ready to See Your Business Data More Clearly?
Contact Neobyte Solutions to discuss your requirements or request a dashboard demo.